Gold and Silver Soar on Rate Cut Expectations
Gold and Silver Soar on Rate Cut Expectations
After last week’s US Inflation reports printed within the forecasted ranges, the probability of a 50 basis-point rate cut at this week’s FED policy meeting rose to an eight-month high.
Not surprisingly, physical Gold and Silver prices posted one of the strongest weekly rallies of the year.
USD Gold rose by 3.2% and reached a new all-time high of $2586.00, while AUD denominated Gold also broke into new high territory at $3855.00 on the way to a 2.7% weekly gain.
Silver prices overwhelmingly outperformed Gold last week as USD Silver hit a two-month high of $30.92 and picked up just under 10% for the week.
AUD Silver reclaimed the $46.00 handle for the first time since mid-July and ended the week 11% higher.
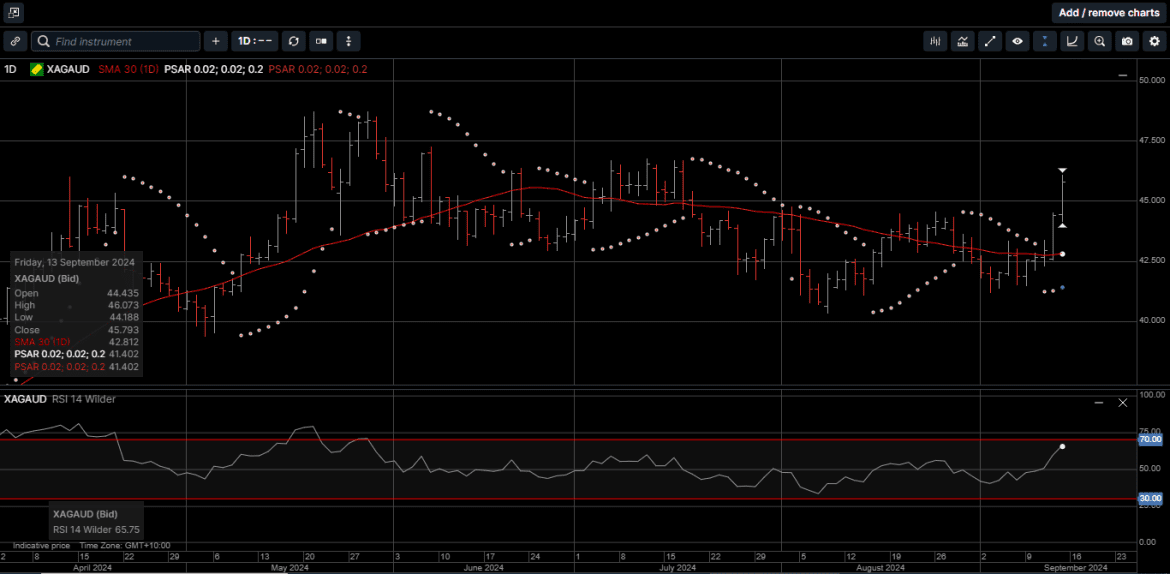
As illustrated on Chart 1, the Gold versus Silver ratio moved by 6.8% in favor of Silver last week. This is the second largest weekly move in favor of Silver versus Gold this year.
Speaking of yearly numbers, with last week’s price action, USD Gold is up 26% for the year, AUD Gold is up 27% and USD and AUD Silver are up 32% and 33%, respectively.
And while a 50 basis-point cut is not a certainty this week, it’s important to note that the precious metals complex has posted strong returns this year without any US rate cuts at all.
Considering that the same forward pricing models back in January expected 100 basis points of easing by mid-September, interest rates are only one of several drivers of the hard asset rally.
Remember, 2024 was meant to be the year when the runaway US budget deficit was supposed to gradually normalize, and after two crisis-years, the US was supposed to end its unsustainable spending.
And for a while there, it seemed touch and go, with the cumulative US deficit initially overtaking 2023, but not as bad as the massive 2021 and 2022 COVID spending when the deficit hit almost 20% of GDP.
And then the US Treasury department announced this: as shown on Chart 2, an August budget deficit of a staggering $380 billion, up more than 50% from the $243 billion in July, and up more than 55% from July, and up 66% from last August.
Further, this $380 billion number for August is almost $100 billion more than the Treasury’s own median estimate of $292.5 billion posted three months ago.
To put a finer point on this, in a year when the monthly budget deficit was ebbing and flowing in a not great but not terrible pattern, someone in the US administration had the brilliant idea to spend tons of money to reboot the economy in August in an attempt to avoid a recession.
And sure enough, US government spending went into overdrive last month, as outlays hit an eyewatering $686 billion, the highest since March 2023, and only a handful of crisis months during the COVID crash saw greater government spending in any given month.
Looking at the big picture, as we expect the FED officials are, it is unfortunately all downhill from here for one simple reason: the US has now crossed an inflexion point in terms of how much it spends on interest on its debt, which is hitting a new record high every day and is growing by about $1 trillion every 100 days.
That means that with interest rates at 40-year highs, according to the Treasury Budget statement, the amount spent on gross interest in August was $92.3 billion.
This means, as shown on Chart 3, the cumulative total for Fiscal year 2024 just hit an all-time high of $1.050 trillion, the first time in history when interest on US debt has surpassed $1 trillion.
As such, the ugly truth is that gross interest on US debt has surpassed not just Defense spending, but also Income Security, Health, Veterans Benefits and Medicare, and is now the second biggest outlay of the US government, second only to Social Security, which is roughly $1.5 trillion annualized.
Based on current US legislative spending forecasts, interest expense will soon surpass Social Security spending and become the single largest outlay of the US government, sometime in late 2024 or early 2025.
This is clearly an unsustainable fiscal path and underscores the benefits of holding physical Gold and Silver as cornerstone assets in a long-term wealth creation strategy.
Gold and Silver have historically represented safety and security for investors of all levels of experience during times of economic uncertainty.
With the US FED preparing to join other central banks in commencing an interest rate easing cycle, now is the time to consider adding to the hard asset portion of your portfolio.
Chart 1 Gold vs Silver ratio:
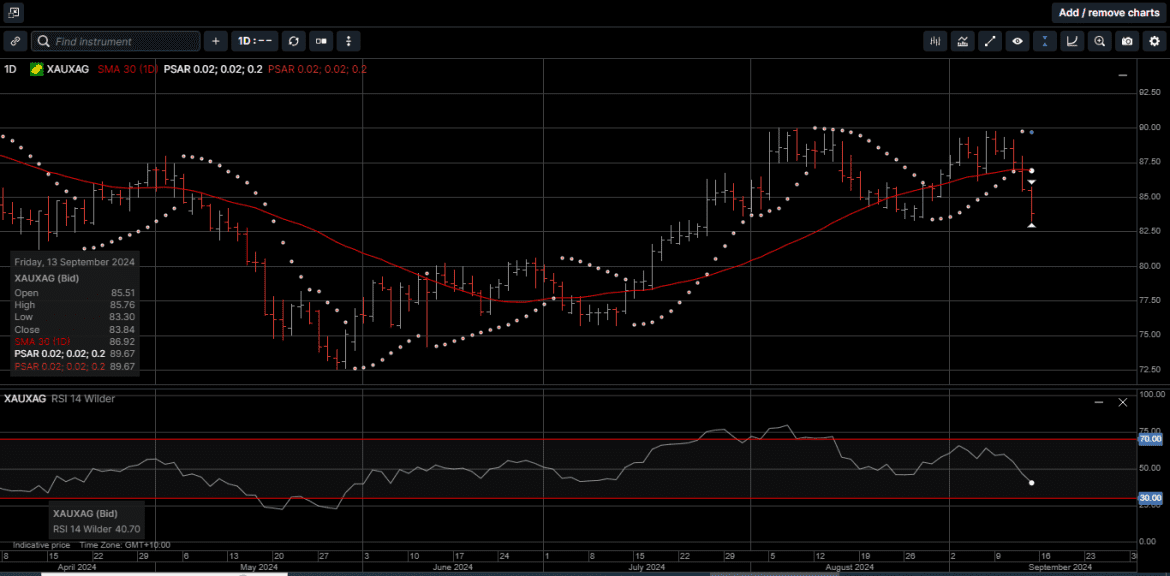
Chart 2 August budget deficit:
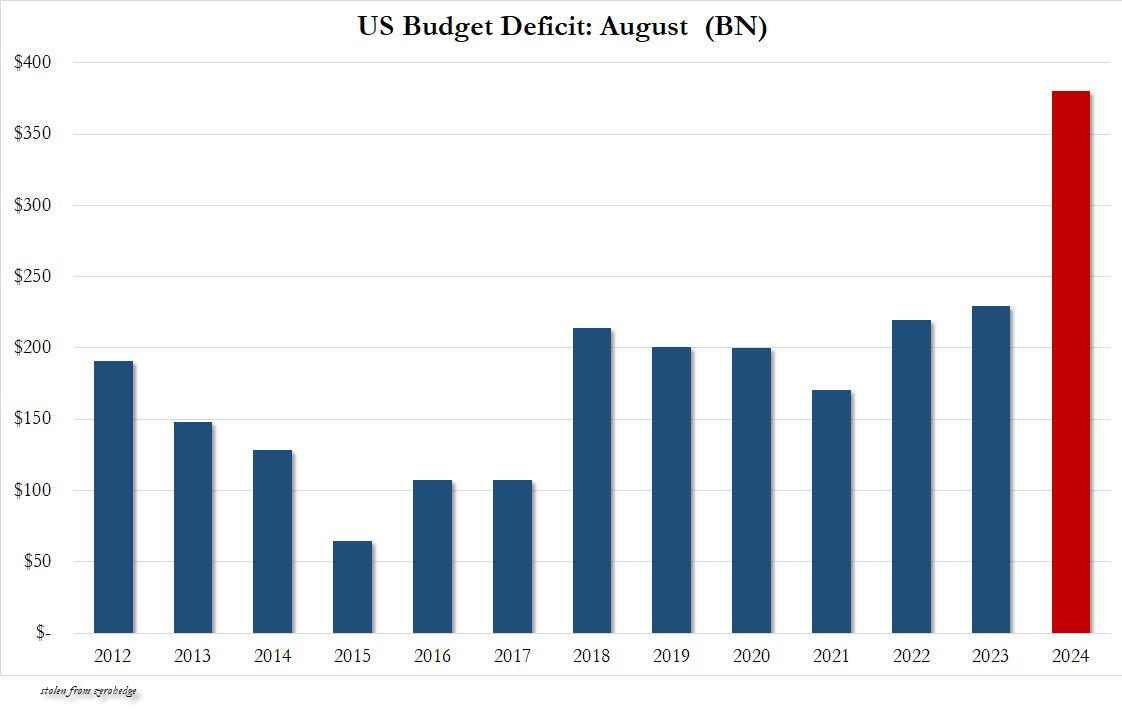
Chart 3 debt servicing:
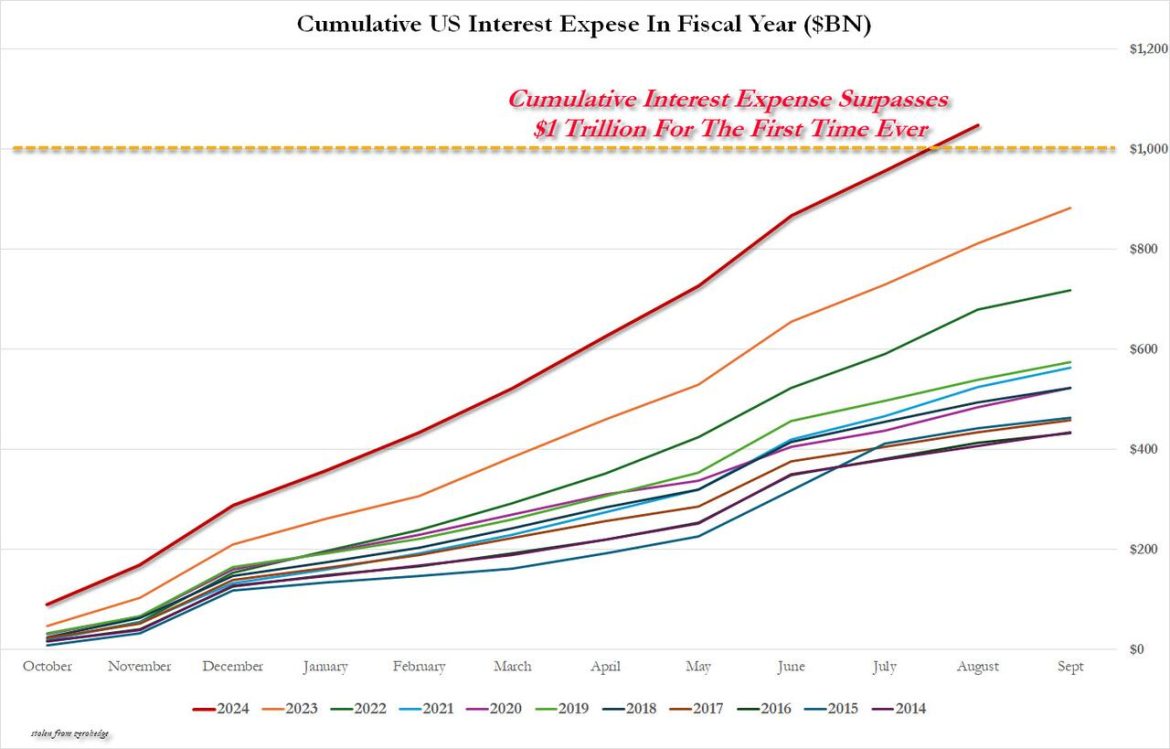
Chart 4 Gold AUD:
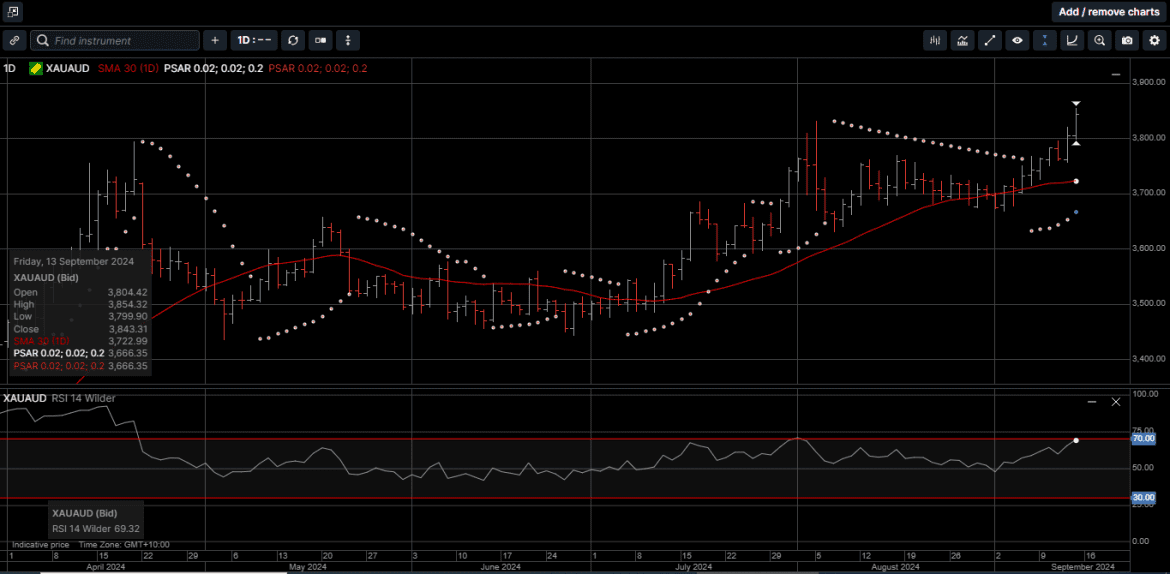
Chart 5 Silver AUD: