Gold Cracks the $3500.00
As April draws to a close, we look back at what could become a defining month in terms of protracted capital market volatility and global economic uncertainty.
And even though the precious metals complex has enjoyed safe haven buying as a result of the market uncertainty, both Gold and Silver continue to see high levels of intraday price volatility.
Physical Gold priced in USD raced to a new all-time high of $3505.00 last Tuesday before reversing lower to test the $3250.00 level during early London trade on Friday. The yellow metal recovered during the NY session to finish the week pretty much unchanged at $3318.00
Gold denominated in AUD also posted a new all-time high at $5440.00 last Tuesday and then slipped lower into the weekend to close fractionally lower at $5204.00
Physical Silver priced in USD showed punctuated bullishness within a broad uptrend to finish the week 1.7% higher at $33.04.
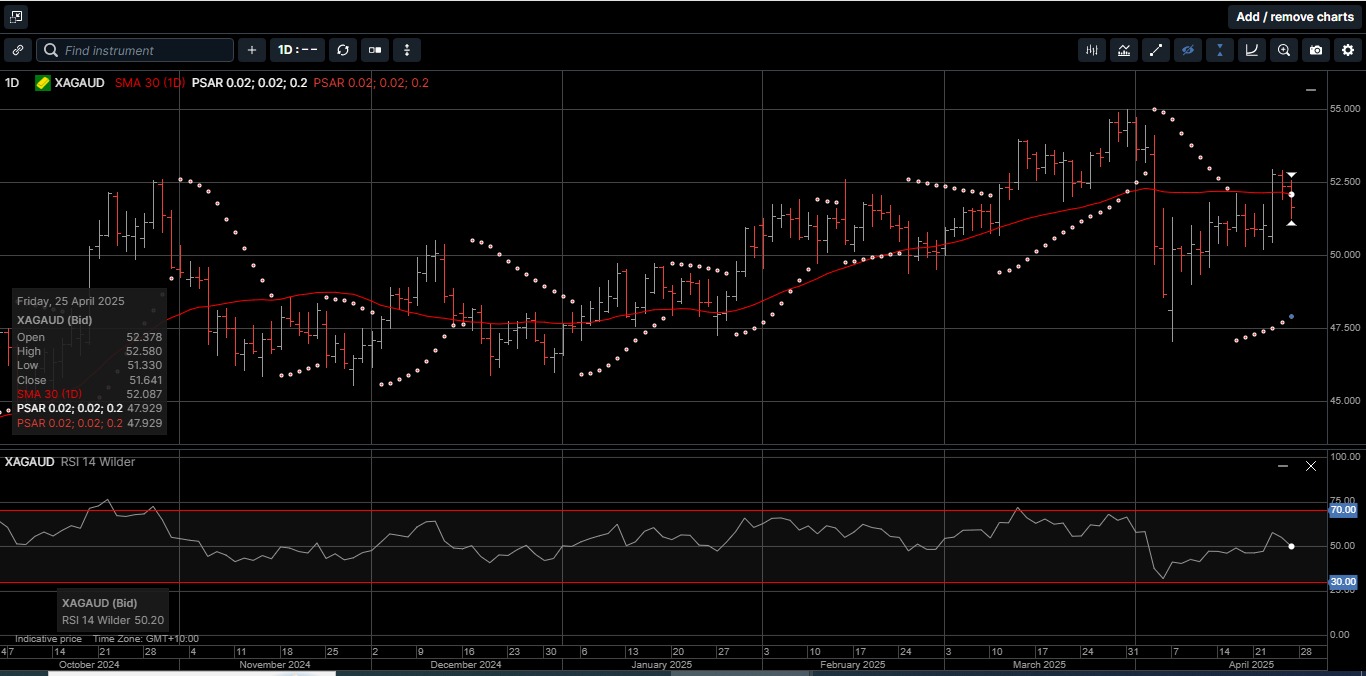
AUD based Silver tagged the $52.00 handle for the first time in three weeks and gained 1.5% for the week to close at $51.65.
As illustrated on Chart 1, the Gold versus Silver ratio touched a five-year high of 107.15 before reversing 9.5% lower to 97.40 and closing the week at 100.20.
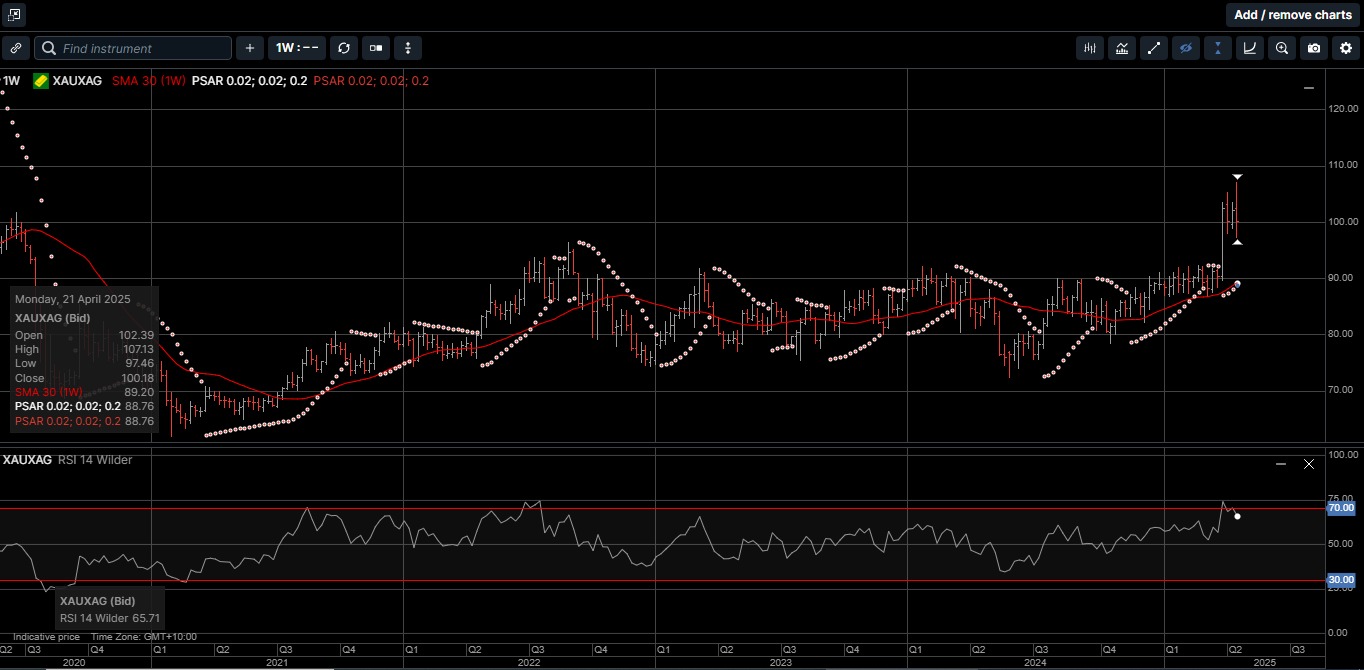
This means it takes 100.20 ounces of Silver to equal the price of one ounce of Gold.
From a technical perspective last week’s reversal lower in the Gold versus Silver ratio suggests the price could fall back into the 80.00 to 92.00 range which contained the ratio from July of last year to the beginning of April.
As such, the price of physical Silver could outperform Gold over the medium term.
Capital markets sent a clear message to investors in April.
US equities, bonds, and the USD all sold off in a dramatic repricing, while Gold and Silver prices moved higher
The global economy has entered a phase of heightened uncertainty, and at the center of this instability stands the United States.
In a reversal of its traditional role as a pillar of predictability and leadership, the US has adopted an erratic posture with sudden policy reversals, which have led to institutional strain.
Nowhere is this more evident than in the US administration’s economic and foreign policy strategy, which increasingly appears less a coherent vision and more an exercise in disorienting escalation.
As shown on Chart 2, these policy inconsistencies have contributed to the 11% drop in the US Dollar Index since early January.
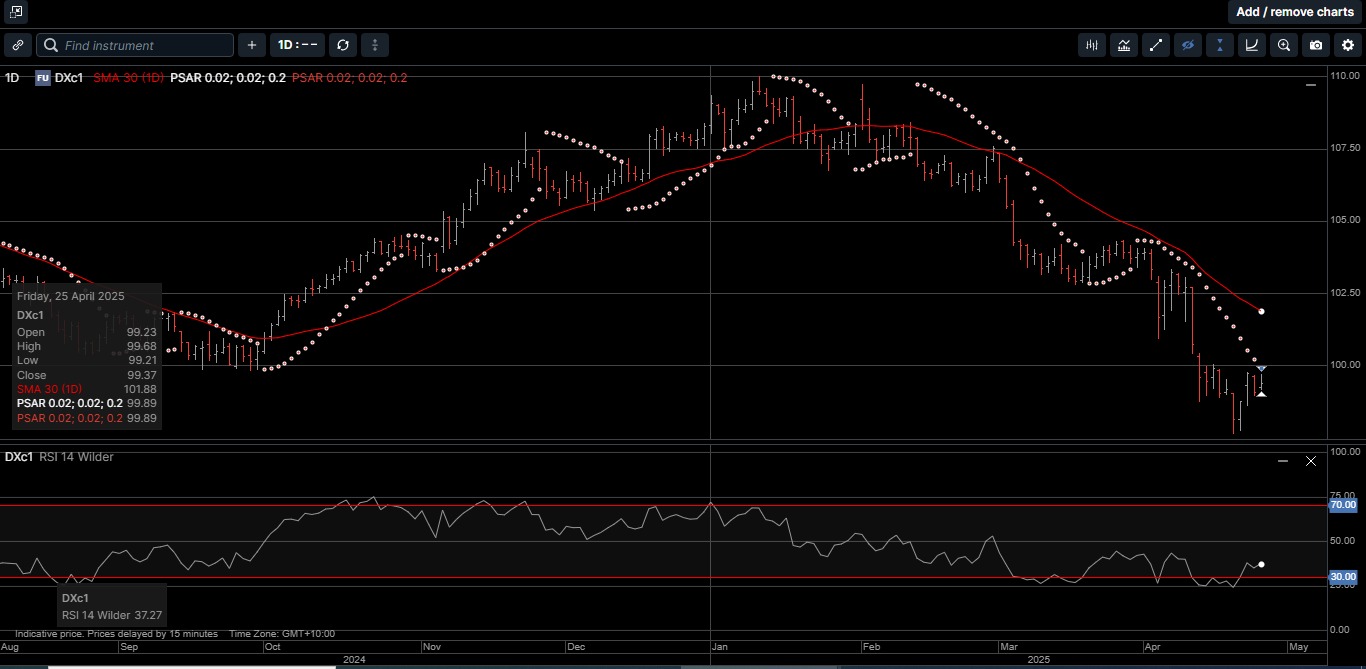
For decades, the US Dollar was the ultimate safe haven. The US administration’s sweeping tariffs were supposed to strengthen the greenback.
Instead, the tariffs have done the opposite, triggering a sharp selloff, stoking recession fears, and putting the USD’s reserve currency status under a global microscope.
The US’s new tariffs, up to 54% on Chinese imports and 10% across the board have sent shockwaves through global markets.
It seems like investors are fleeing, not just from Wall Street stocks, but from US Treasuries and the USD itself.
The reason for the exodus is because tariffs could put US growth at risk, sparking fears of stagflation: rising prices, falling demand, all with the US Federal Reserve currently stuck in neutral with respect to interest rates.
Historically, market turmoil sends capital rushing into the USD.
But not this time. Foreign money is rotating out of US assets, which, as shown on Chart 3, is bad news for a country running a $36 trillion deficit and a debt to GDP ratio of over 100 and climbing.
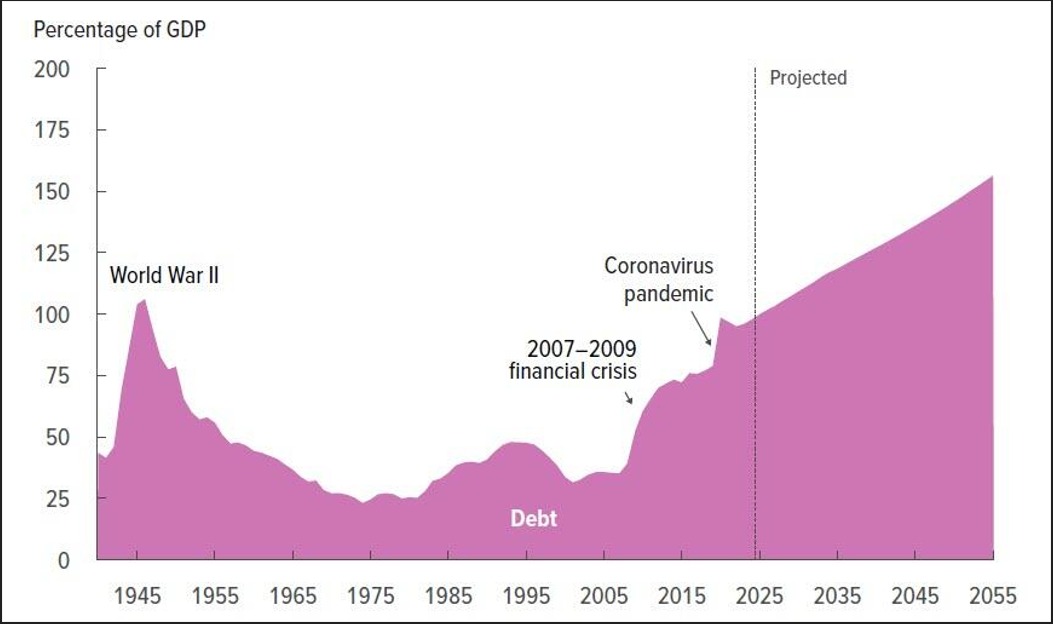
Some market commentators are warning of a crisis of confidence in the USD. And major investment houses are now pledging to reduce USD exposure in favor of diversified hard assets including Gold and Silver.
And while it’s clear that the USD is currently holding up as the world’s reserve currency, the market activity so far this year shows that the USD’s status is starting to wobble.
Based on the price performances so far this year, one could argue that central banks and investors alike are preparing for a world where the USD is no longer the unquestioned reserve currency, and where Gold and Silver are the preferred assets to secure and grow wealth.
Whether you’re hedging against inflation, a weaker USD, or growing global uncertainty, Gold and Silver offer time proven protection you can hold and store as part of a diversified wealth creation strategy.
Chart 4 Gold AUD
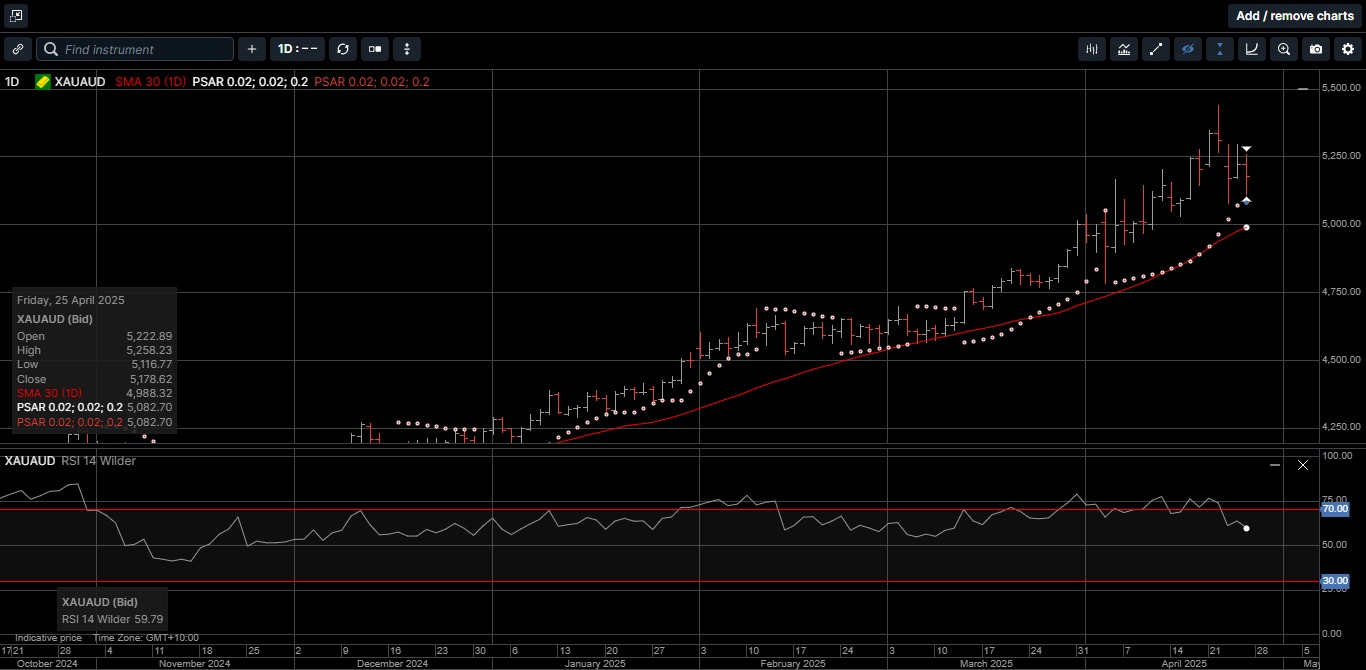
Chart 5 Silver AUD
This publication has been prepared for the GBA Group Companies. It is for education purposes only and should not be considered either general of personal advice. It does not consider any particular person’s investment objectives, financial situation or needs. Accordingly, no recommendation (expressed or implied) or other information contained in this report should be acted upon without the appropriateness of that information having regard to those factors. You should assess whether or not the information contained herein is appropriate to your individual financial circumstances and goals before making an investment decision, or seek the help the of a licensed financial adviser. Performance is historical, performance may vary, past performance is not necessarily indicative of future performance. Any prices, quotes or statistics included have been obtained from sources deemed to be reliable, but we do not guarantee their accuracy or completeness.