Gold and Silver Rebound on US Credit Stress.
Global capital markets experienced extreme volatility last week with several days of record-breaking trading volumes across various asset classes.
And while the traditional directional correlations between stocks, currencies and interest rates were inconsistent, liquidity stress in the US bond markets catalyzed a sharp rally in physical Gold and Silver prices.
Gold priced in USD slipped as low as $2955.00 before exploding $290.00 higher to reach a new all-time high of $3245.00. The yellow metal settled up 6.7% at $3237.00 for the largest weekly gain in the history of spot metal trading.
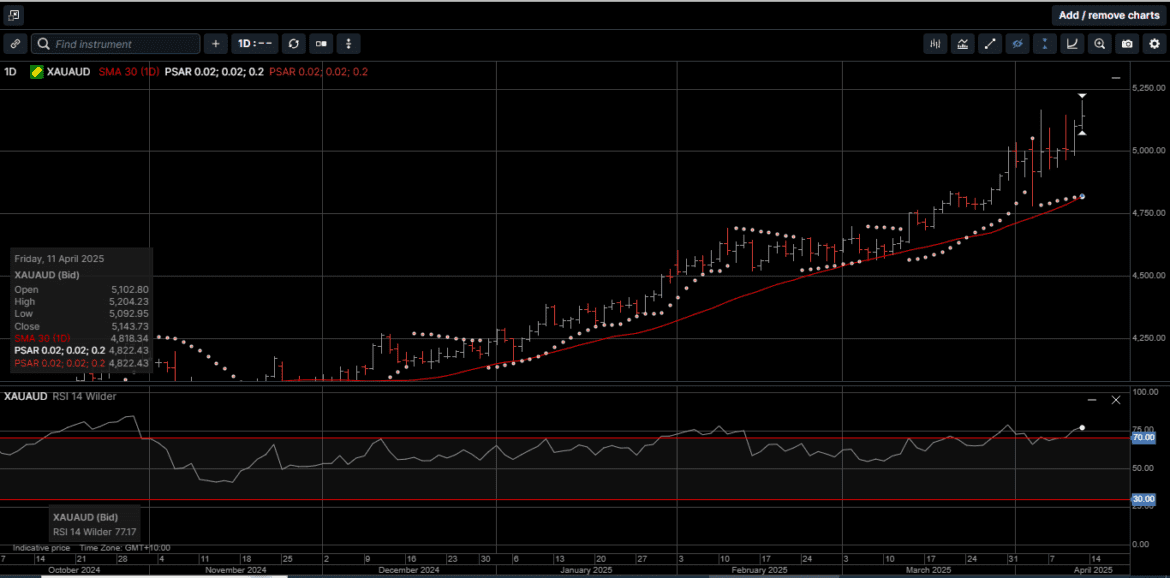
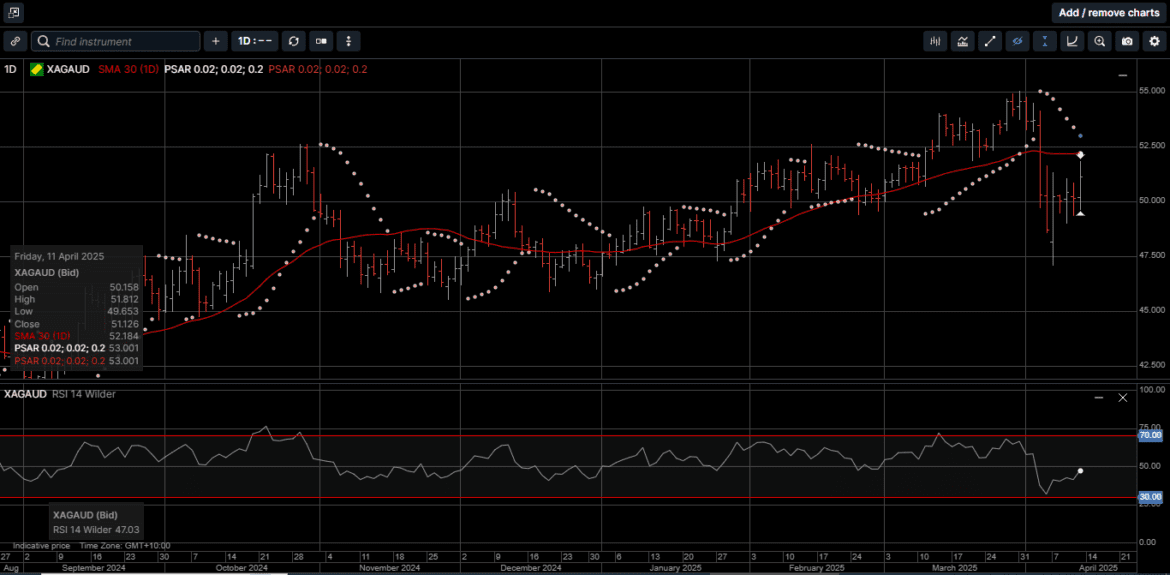
After testing the 30-day moving average line near $4760.00, Gold denominated in AUD also reversed higher to post a new all-time high at $5209.00 before slipping lower into the weekend to close 3.1% higher at $5143.00.
Physical Silver based in USD recovered more than half of the previous week’s losses to settle 8.8% higher for the week at $32.20, while Silver priced in AUD also rebounded to post a 5.1% gain and settle at $51.15.
Even though Silver outperformed Gold last week, the Gold versus Silver ratio hit a five-year high of 105.25 before reversing lower to close the week at 100.20.
This is compared to a price of 92.00 on April 1st, which means it may take several weeks of Silver price strength to return the ratio back to the trading ranges seen last month.
So, what was the catalyst that lifted Gold and Silver off the lows early last week and drove the rally into the weekend?
Last Tuesday, Wall Street stock indexes were getting hammered lower on US tariff fears.
The S&P 500 collapsed to under 5,000, around 18% below its all-time high of 6,144 in February, while the NASDAQ and Dow Jones 30 were also suffering double digit losses.
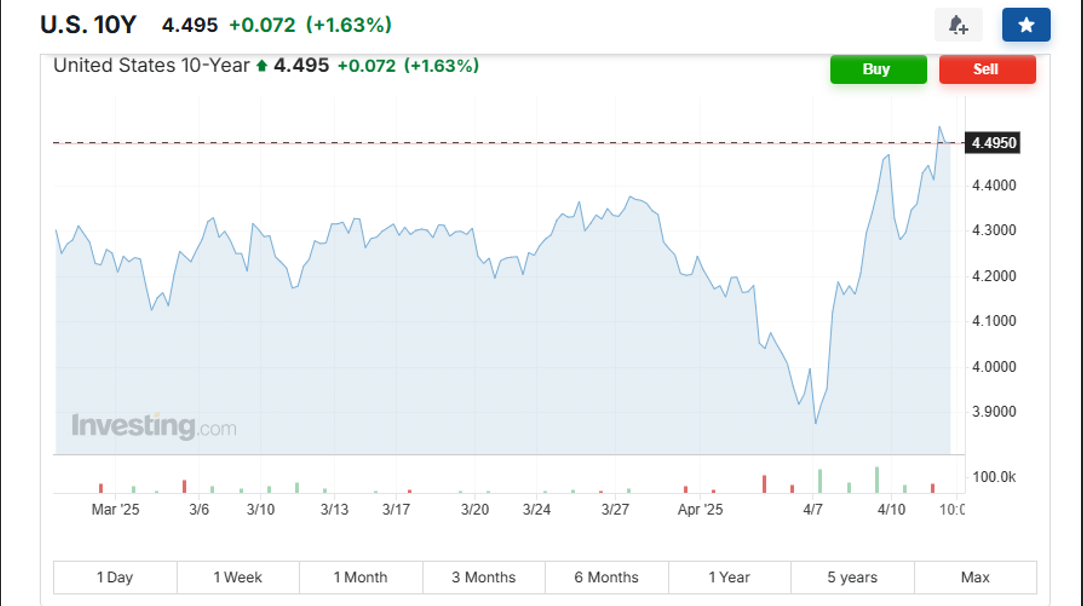
Usually, when stocks go down, investors flee to the safety of bonds, and bond prices go up (yields go down). But last Tuesday, bonds prices were also going down (yields going up).
As illustrated on Chart 1, the yield on the 10-year Treasury rose from 3.9% and briefly hit 4.51%. (Remember: If yields are going up, it means bond prices are going down).
This was a very unusual dynamic and meant there was nowhere “safe” for money to hide except for the safe haven of Gold and Silver.
As the trading day progressed, market analysts determined that the disfunction in the US bond market was due to the unwinding of positions in the “Basis Trade.”
It turns out that over the last 10 years, hedge funds have been placing bets with up to 100 times leverage on the price difference between Treasuries and Treasury futures contracts. In other words, the basis trade.
In the bet, to put it simply, the funds will buy the Treasury bond and then short the differently priced futures contract on a similar bond.
In theory, as the bond comes up on its expiry date, the prices converge; the futures price comes down, and the short bet pays off.
The price differences are small, which is why hedge funds use 100 times leverage to make money on them. It’s estimated that the basis trade could be as large as $700 billion within the $2 trillion outstanding in prime brokerage bond balances.
The biggest problem with 100 times leverage, of course, is that a small percentage move against the position can pencil out to a very large unrealized loss.
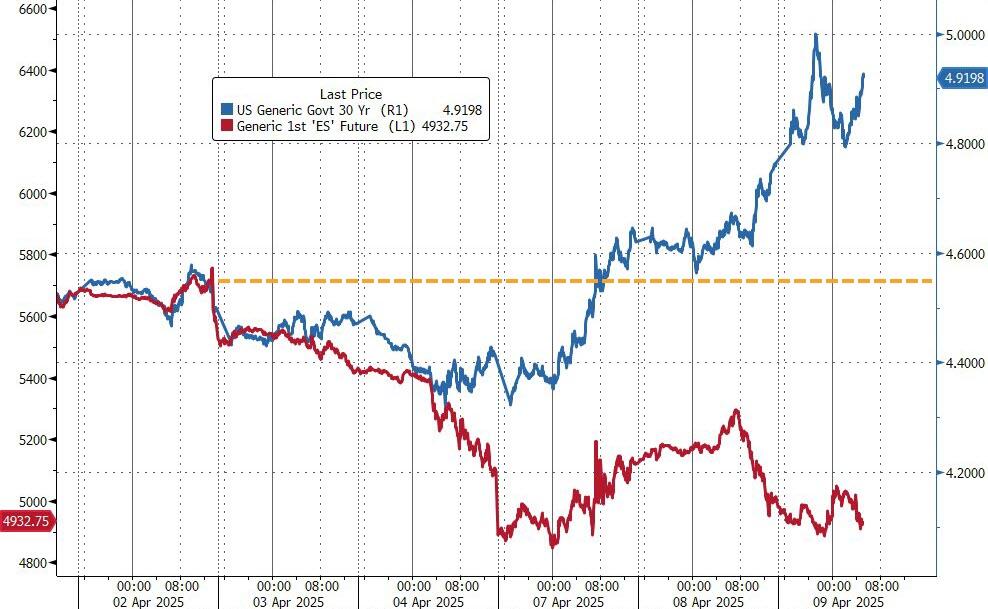
And what the bond market, with its falling prices in tandem with stocks, seemed to be signaling last week was that there was a liquidity problem among hedge funds and banks that were scrambling to exit the basis trade in order to raise and hold cash.
As shown on Chart 2, when there is a liquidity problem on the scale seen last week, the bond market potentially could lead to systemic, institutional stress.
As last week drew to a close, the prevailing market consensus was that if the US Federal Reserve doesn’t step in soon to lower rates and provide emergency liquidity to cover losses, this basis trade unwind could turn into a full-blown credit market crisis.
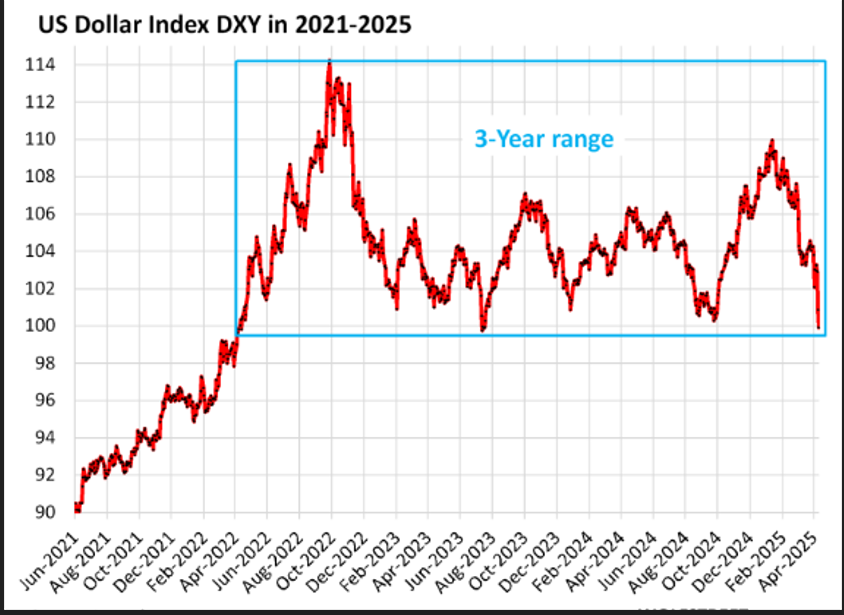
With those prospects, it is not surprising to see on Chart 3 that the USD Index has dropped to the lower end of its three-year range, which was a significant driver of the precious metals rally.
After last week’s rally, USD based Gold is up 23.4% for the year, AUD Gold is up 21.5%, while Silver priced in USD and AUD have gained 11.5% and 9.5%, respectively.
The US Administration’s guidance on trade tariffs is fluid and unpredictable.
However, last week’s strong rally underscores the sentiment that Gold and Silver are high conviction assets for secure, long-term wealth creation strategies for investors of all levels.
Chart 4 Gold AUD
Chart 5 Silver AUD
This publication has been prepared for the GBA Group Companies. It is for education purposes only and should not be considered either general of personal advice. It does not consider any particular person’s investment objectives, financial situation or needs. Accordingly, no recommendation (expressed or implied) or other information contained in this report should be acted upon without the appropriateness of that information having regard to those factors. You should assess whether or not the information contained herein is appropriate to your individual financial circumstances and goals before making an investment decision, or seek the help the of a licensed financial adviser. Performance is historical, performance may vary, past performance is not necessarily indicative of future performance. Any prices, quotes or statistics included have been obtained from sources deemed to be reliable, but we do not guarantee their accuracy or completeness.