Gold and Silver Are Building Upside Momentum
Due to the US Thanksgiving holiday last Thursday, trade flows in the precious metals complex were notably reduced last week.
Trading ended at noon in the US on Wednesday; the market was entirely closed on Thursday and trading desks on Friday were operating on a skeleton crew basis.
Still, intraday prices for physical metal saw wide swings as the daily implied volatility for Gold rose to a three-month high of 16.3.
Gold priced in USD tested the $2600.00 level a couple of times on Monday before grinding higher and reclaiming the $2650.00 level for a 2.4% loss for the week.
Gold denominated in AUD traded above $4000.00 every day last week but slipped 2.6% lower on strength in the AUD/USD to close just over the $4060 level.
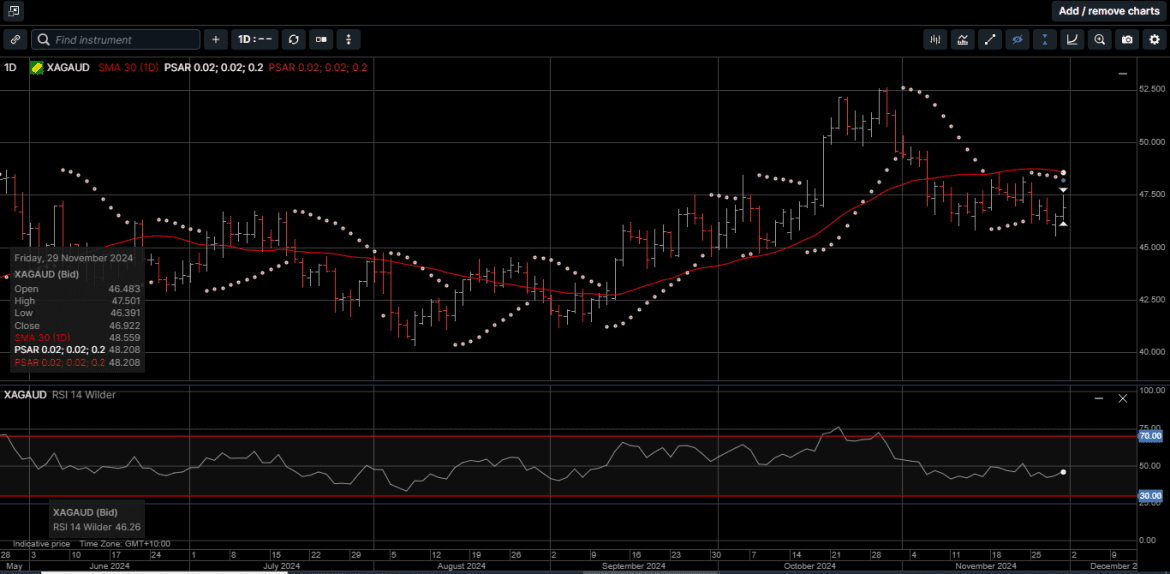
Physical Silver prices were also pressured lower with the USD-based Silver falling 2.3% to $30.60 and AUD Silver posting a 2.5% loss to close the week just under $47.00.
It’s worth noting that the Gold vs Silver ratio tagged a 2.5 month high of 88.35 before reversing lower to close the week at 86.95.
Considering the ratio has ranged between 89.00 and 77.50 since June, it’s reasonable to expect Silver to outperform Gold over the medium term.
And while most investors were on the sidelines enjoying the holiday, the number crunchers in Washington D.C. were on deck and releasing data.
Specifically, the Federal Reserve (FED) released its financial report for the third quarter on Friday afternoon.
The two items we pay attention to are its operating losses and its “unrealized” losses.
As illustrated on Chart 1, the FED incurred $19.9 billion in operating losses in the quarter, down from $30.8 billion in Q3 a year ago, but up a little sequentially from Q2.
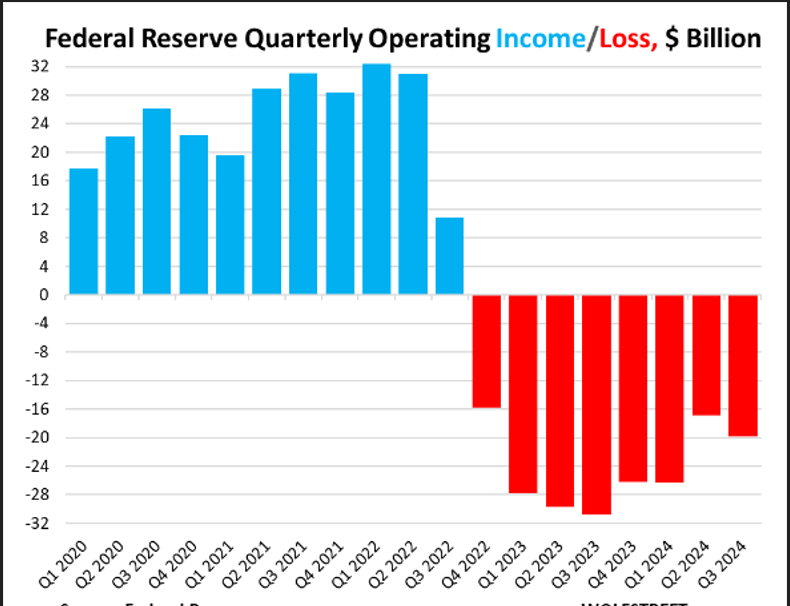
Those losses are largely the difference between the interest income it earns on its huge but shrinking portfolio of Treasury securities, and the interest it pays to banks and money market funds on the cash they keep at the FED.
When the FED started hiking rates in early 2022, the interest it paid to banks and the interest it paid money market funds rose in tandem because they’re two of the FED’s policy rates.
And so, the interest expense shot up with higher rates, even as the combined balances began to decline due to Quantitative Tightening (QT).
But the interest income was capped as the FED held a portfolio of longer-term securities whose interest rates didn’t go up. And then, as QT reduced those holdings, interest income from them also declined.
So the interest income was capped and then started declining under QT, but the interest expense shot up with the higher policy rates, and by September 2022, the Fed started losing money.
Depending on its future interest rate policies and the pace of QT, it will take several more years before the FED stops generating operating losses, which is fundamentally bullish for Gold and Silver
The FED’s cumulative unrealized losses declined to $818 billion on September 30, from $1.075 trillion at the end of Q2, and down from $1.302 trillion at the peak, which was the end of Q3 2023.
Since the FED creates its own money, it cannot really become insolvent in the literal sense.
However, losses matter a great deal to the US Treasury Department.
The FED has to remit nearly all of its operating income to the Treasury Department.
Those remittances stopped when the FED stopped generating operating income. The losses pile up on the liability side of its balance sheet as a negative amount due the Treasury Department.
As shown on Chart 2, as of the last balance sheet released November 21st, that negative amount reached $210 billion representing the total cumulative operating losses since September 2022.
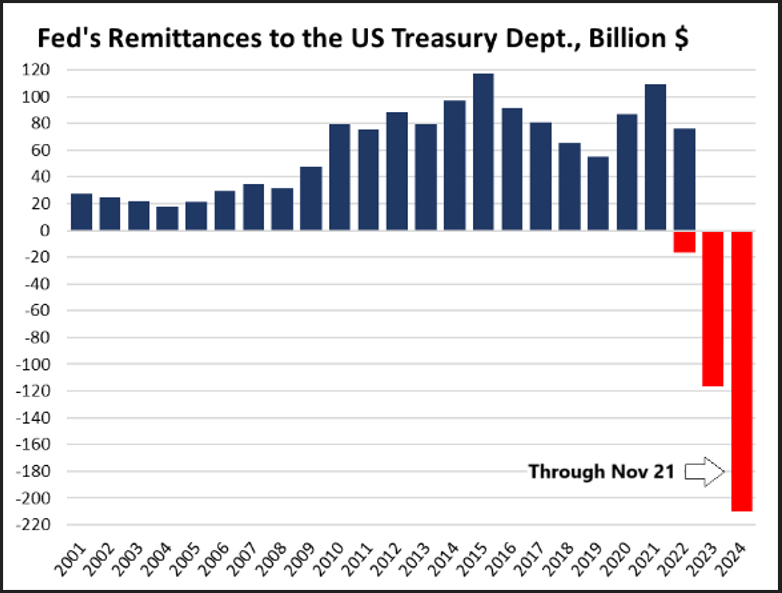
Even if their current rate cut trajectory is adhered to, the FED will continue to have operating losses for a while, and the cumulative negative amount to the Treasury Department will grow.
When the FED finally generates operating income again, it will go against that negative amount and whittle it down over time, and remittances to the Treasury won’t restart until the negative balance has been reduced to zero and then turns positive.
This will take many years and is a source of uncertainty and potential systemic risk to the US as well as the global banking system.
For centuries, Gold and Silver have been considered a store of value and a hedge against economic uncertainty.
As a physical commodity, they cannot be printed like money, and their value is not impacted by interest rate decisions made by a central bank, or fiscal decisions made by a government.
As such, the recent pullback in the prices of Gold and Silver offers an excellent opportunity to add more secure hard assets to your portfolio within a diversified wealth creation strategy.
Chart 3 Gold AUD
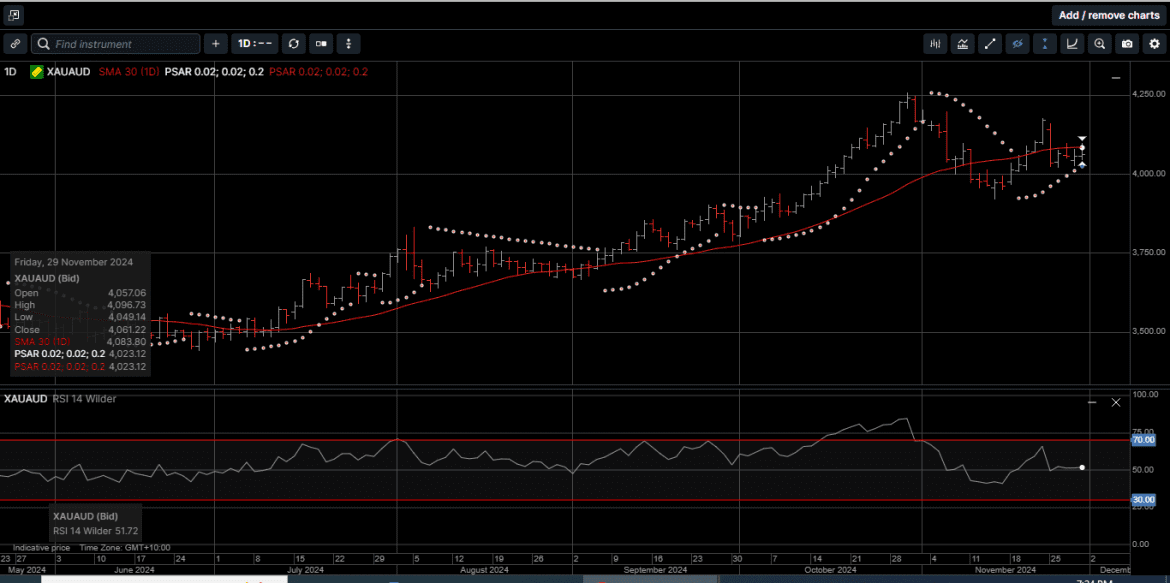
Chart 4 Silver AUD
This publication has been prepared for the GBA Group Companies. It is for education purposes only and should not be considered either general of personal advice. It does not consider any particular person’s investment objectives, financial situation or needs. Accordingly, no recommendation (expressed or implied) or other information contained in this report should be acted upon without the appropriateness of that information having regard to those factors. You should assess whether or not the information contained herein is appropriate to your individual financial circumstances and goals before making an investment decision, or seek the help the of a licensed financial adviser. Performance is historical, performance may vary, past performance is not necessarily indicative of future performance. Any prices, quotes or statistics included have been obtained from sources deemed to be reliable, but we do not guarantee their accuracy or completeness.